By Bill Bialkowski, Snug Harbour
Water levels have finally started to come down from last yearŌĆÖs near record-breaking high, and we hope that the super high-water period, which started in the spring of 2014, is finally abating after seven years.┬Ā┬Ā Water levels this summer are predicted to be a foot lower than last summerŌĆÖs. This extraordinary high-water period came on the heels of fifteen years of unprecedented low water on Lake Michigan-Huron and our Georgian Bay, when some people could not even get to their cottages by boat, and wetlands dried up. Water levels last August almost exceeded the all-time record high established in October 1986, of 177.5 metres above sea level. In October ŌĆś86, the water flow in the St. Clair River set an all-time high record of 6,740 cubic metres per second. To make these numbers more meaningful, a cubic metre of water weighs a metric tonne – that is a lot of water flow each second! Imagine the force behind that water when it is moving at nearly 5 feet per second. It was during such an incredibly high flow in 1986 that the last known serious erosion of the St. Clair River bottom occurred. That winter, with such high flow rates, an ice jam caused a sudden reduction in flow of nearly 50%. Ice jams tend to scoop up bottom material, which is then deposited down-river and causes navigation problems.┬Ā The US Army Corps then embarks on navigation dredging, which increases water conveyance.┬Ā Those 1986 events enlarged the St. Clair River conveyance capacity and contributed to the very low water we experienced between 1998 and 2013.
During the high water of August 2020, the St. Clair River flow reached an unprecedented flow rate of 7,340 cubic metres per second, breaking the 1986 record by 9%. Again, it appears that St. Clair River erosion has occurred, although this cannot be confirmed until the USACE completes its bathymetry (depth) surveys.┬Ā This winter, after ice formed, a St. Clair River ice jam in early February caused the flow rate to plummet from 7,000 cubic metres per second to 4,000 (a 43% reduction). See below:
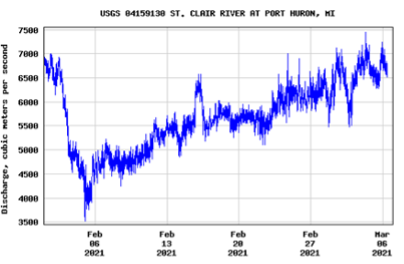
St. Clair River Ice Jam February 2021 flow restricted from 7,000 to 4,000 cubic metres per second
These events are almost identical to those of 1986 and will likely further exacerbate our next period of low water.
The report above quickly updates the water-level events in the physical world of hydraulics and water depths. However, there are also man-made events to report.┬Ā Last October, GBFŌĆÖs David Sweetnam and GBAŌĆÖs Rupert Kindersley jointly organized a 4-hour water levels webinar.┬Ā They invited speakers from Environment Canada (EC), US Army Corps of Engineers (USACE) and academia. Mary Muter and I (Mary chairs the Georgian Bay Great Lakes Foundation, GBGLF, and I am a director; we are both directors of Restore Our Water International, ROWI) were asked to provide input. We prepared slides for this purpose.┬Ā However, during the webinar, with no notice to us, we were completely excluded and not allowed to present.┬Ā For clarification, in 2003, it was MaryŌĆÖs leadership, then at GBA, that resulted in early modeling of water levels, which led to a GBF-funded water levels investigation by Baird and Associates, and the Baird Report in 2005.┬Ā It exposed previously unknown St. Clair River erosion as a major contributing cause of the low water levels we were then experiencing.┬Ā When this report was presented to the IJC, the response was the launching of the 2007 to 2012 International Upper Great Lakes Study (IUGLS).
Returning to the GBF/GBA webinar, after reviewing all of the input, opinions, questions and answers, GBF/GBA have jointly adopted a position on water levels, the gist of which is.┬Ā Climate change has changed everything, and will lead to higher highs and lower lows.┬Ā All past data is useless for predicting future trends. The primary driver for water levels is the ever-changing, and uncertain net basin supply. Governments and the agencies: IJC, USACE and EC have very little ability to influence the outcome.┬Ā There is no evidence that the agencies are not doing a good job, and no significant improvement can be made.┬Ā So, stop complaining to the IJC, EC and USACE when water levels are not to your liking.┬Ā┬Ā Regarding high water, there is nothing that can be done to lower high water levels.
Really?┬Ā LetŌĆÖs look at high water first, and then low water and level cycles.
High Water. Nothing can be done to lower high water?┬Ā Actually, two modest improvements can be made during high levels.
First, the Long Lac and Ogoki water diversion from the James Bay watershed into Lake Superior has raised Lake MH by 11 cm (4 inches) for the benefit of OPGŌĆÖs power generation in northern Ontario, and the many generators downstream, but without any consideration for water levels downstream.┬Ā You would think that that IJC, under the powers given it by the 1909 Boundary Waters Treaty, could negotiate a reduction during high water, as was done during high water in the ŌĆś70s, ŌĆś80s and ŌĆś90s. During high water, this diversion reduction might lower MH by 2 inches.
Secondly, the water discharged from Lake Superior into MH is governed by Regulation Plan 2012, which is supposed to ŌĆśbalanceŌĆÖ the water levels between the two lakes.┬Ā We have been complaining to the IJC that this ŌĆśbalancingŌĆÖ does not appear to be working effectively, and the IJC has confirmed that it has now started a review of Plan 2012. This re-balancing might be able to lower MH by a further few inches.
Low Water and Water level Cycles. The biggest concern is during low water levels, which are going to return soon enough.┬Ā Recently, GBGLF commissioned Baird and Associates (authors of the 2005 Baird Report) to complete an analysis of water-level cycles that they had started during the Baird Report work in 2003, but could not complete due to unknown St. Clair River conveyance changes. (The IJCŌĆÖs Upper Lakes Study later confirmed a St. Clair River conveyance capacity increase of 5% in 1986)
It has long been known that Lake MH levels tend to vary as a combination of a various ŌĆśQuasi-periodicŌĆÖ cycles.┬Ā Roughly, water levels are a combination of a 160-year cycles and 30-year cycles.┬Ā More accurately, these are all a combination of: 80-year and 11-year sun spot cycles, 30-year precipitation cycles, 5-to-10 year North Atlantic and Pacific El Ni├▒o cycles, and finally the annual cycle. Some of these drivers are likely influenced by climate change, but sun spots are not. Shown below is a graph (Fig. 4.4 from the Baird III Report) from 1850 to 2100, which compares actual water levels (thin black line), to cycle-based predictions (red and blue).┬Ā Actual measurements end in 2020, with only predictions beyond 2020. As you can see, the predictions line up with reality almost perfectly up to 2020.┬Ā The same calculations have been used to predict future water levels.┬Ā This analysis has been compensated for the conveyance changes in the St. Clair River that in 2020 were known to have occurred.
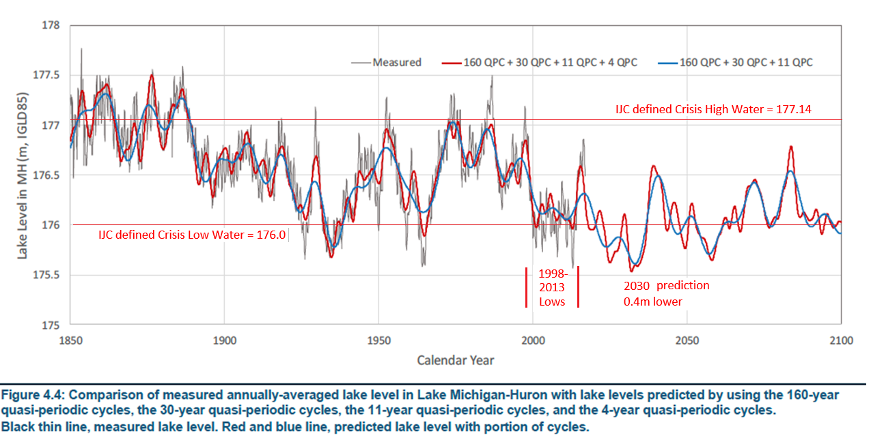
This analysis predicts that our next low water will be in about 2030, and the level will be about 0.4 metre (about 16 inches) lower than what we experienced between 1998 to 2013.┬Ā┬Ā Having lived through the previous low water, we feel that does not sound good.
Low Water Remedy. The IJC has acknowledged that when a river emptying a lake has been dredged, hence increasing its conveyance capacity, this action permanently lowers the lake level, especially during times of low water. Accordingly, in the past, whenever such a riverŌĆÖs conveyance capacity had been increased, the IJC required conveyance compensation structures to be built in order to restore the natural conveyance capacity of the river and the level of the upstream lake.┬Ā After the Seaway was built, in 1962 the conveyance of the Detroit River was restored by building a compensating dyke. Work started to compensate the St. Clair River also, but high water occurred before it could be finished, and the project was abandoned.┬Ā The IJC confirms that past dredging and the 1986 erosion have combined to lower Lake MH by 50 cm (20 inches).┬Ā What might it be now, given evidence of recent ice jams and erosion ŌĆō 55 cm (22 inches)?┬Ā We donŌĆÖt know.
The last 2012 IJC International Upper Great Lakes Study was led by a retired US Army General, who told Mary Muter, that ŌĆ£nothing will be ever be done in the St. Clair River in my lifetimeŌĆØ.┬Ā Indeed, in spite of the fact that the study confirmed a Lake MH lowering of 50 cm (20 in.), it recommended that ŌĆ£nothing be done in the St. Clair RiverŌĆØ.┬Ā During the 2012 public review of this study, public pressure (at the Parry Sound, Midland and Collingwood meetings) convinced the IJC to reverse its recommendations.┬Ā This resulted in the IJCŌĆÖs 2013 recommendation to governments (Canada and US) that flexible structures that would hold back water only during low water periods be considered for the St. Clair River.┬Ā Unfortunately, both governments have ignored this IJC recommendation for nine years now.
This raises the question: are the governments and agencies really doing a perfect job on water levels?┬Ā You decide.