By Bill Bialkowski, at Snug Harbour, October 25, 2020
In the spring newsletter, I wrote a water levels update article that I now know was quite inaccurate. My summer and fall have been filled with water level activity, and I will try to update you as succinctly as possible.
This year has again been dominated by super high-water levels, although now in October, the levels are dropping in what appears to be a normal seasonal decline. However, no one has a clear picture of what is happening and why. The government agencies have all been saying the high water is due to super high net basin supply (NBS) – climate change – nothing can be done -so get used to it.
In the spring I received a dataset of net basin supplies from Environment Canada CC. You may recall that there are two ways to compute NBS: 1) the ‘components method’ that tries to estimate precipitation on the lake, plus runoff from the basin, less evaporation (used by Environment Canada CC); and 2) the ‘residuals method’ that measures the accumulated volume of water as lake levels change month-to-month, less flows in, plus flows out (used by the US Army Corps of Engineers – USACE). Both of these methods have accuracy challenges, but the residuals NBS for Lake Michigan-Huron (M-H) has faced the problem that the flow of the St. Clair River (SCR) was historically only estimated. Recently a meter was installed, but this spring I considered the measurement to be way off. Hence, I considered the residuals NBS to be highly suspect.
So, in the spring as per my article, I compared the components to the residual NBS and found that while the residual NBS was rising from 2000 to 2020, the components NBS was falling, the very opposite of what people were saying. So, based on the components method NBS, I put together a hydraulic model of Lake M-H plus the flows in-and-out and concluded as described in my article, that it appeared that sand had accumulated in the St. Clair, and the water was being held back – this was a potential reason for the higher than normal water levels. As an engineer, I have been building hydraulic models since the sixties, and of Lake M-H and the SCR since 2003, first for GBA, then for Georgian Bay Great Lakes Foundation (GBGLF), headed by Mary Muter, and Restore Our Waters International (ROWI) headed by Roger Gauthier. Mary brought about the 2004 Baird Report that found previously unknown SCR erosion, and Roger was the chief hydrologist for USACE for forty years. GBGLF has supported McMaster U’s Prof. Pat Chow-Fraser ‘s research that has linked the water level issues to wetland and environmental health, and both Mary and Roger represent the shoreline interests around Lake M-H and Georgian Bay.
Of particular interest was the fact that the USACE were now using an Acoustic Doppler Velocity Meter (ADVM) in the SCR to measure the SCR flow and were reporting flows well over 7,000 cubic metres per second (cms) or over 250,000 cubic feet per second. These flows exceeded the 1986 maximum flows to-date ever recorded. I had kept a velocity profile graphic of the river when this meter was first installed, and based on that, it appeared that they were using a cross-section area that was easily 40% larger. So, in June, we sent my analysis and observation about the ADVM to John Allis, the current chief hydrologist at the USACE. This resulted in a summer-long exchange of technical notes and several conversations.
In 1965, I was in the Royal Canadian Navy and was then a sonar system engineer in charge of testing the accuracy of a new sonar on one of our destroyers. So, for me, the accuracy of an acoustic doppler velocity sensor was not totally foreign.
What I did not know, was that the meter, for which I had that velocity profile, had been moved to a new location just south of the Point Edward Casino, and here the river is much wider. In our discussions with the USACE staff, we went through the full range of computation algorithms and accuracy-related issues and concluded that the meter was in fact accurate and that indeed the flows do actually exceed 7,000 cms. The bottom line – the reason for the super high-water levels is in fact the unprecedented high net basin supply – climate change.
Given an accurate SCR flow measurement, we can now expect the residuals method NBS to be accurate as well. Armed with this, I was able to run a new model. This established a full water balance over the last 20 years, however only after allowances were made for SCR erosion. My initial model suggested erosion of as much as 75 cm in an average river depth of 10 m. The USACE have since confirmed that they have detected erosion, but their estimate was in the range of 10 to 20 cm. I have since re-run the model to better account for winter ice retardation impacts and found the erosion estimate now appeared to be less than 10 cm. Of course, these estimates need to be verified by regular bathymetric (depth) studies. The last bathymetry study released was in 2005. Apparently, the USACE did bathymetry studies in 2007, 2012, 2018, but nothing has been released. We are now promised 2019 and are waiting.
Whatever the right amount of erosion might actually be, any erosion means when we once again experience super low water levels, that the levels will now be lower by more than the 50 cm (20 inches), which the IJC has so far confirmed to be the impact of all past dredging and erosion.
To bring this into more focus, we have had Baird and Associates study past water level cycles. You probably have heard that water levels are cyclical and that M-H cycles are dominated by a very long 165-year cycle, together with a faster 35-year cycle. Baird predictions line up with actual history very well for the last 150 years. Going out into the future they predict that our next bout of low water will begin soon and then be even lower in about ten years time (2030), when the water levels will be about 15 inches lower than they were in the 2000 to 2013 period. (Baird Report III is available @ georgianbaygreatlakesfoundation.com)
In 2013, I was able to walk on the exposed dry mud right to Gilly’s restaurant in Snug Harbor. Imagine a level 15 inches lower!
Let me turn briefly to the Web Symposium organised jointly by GBA and GBF, and held Saturday, October 24. While GBA’s Rupert Kindersley’s objectives were well intentioned, you should know that the GBGLF material that was prepared at Rupert’s invitation was ultimately barred from presentation. Our Q&A slides for that are also posted at georgianbaygreatlakesfoundation.com
For those interested, here is my summary of what has ailed us during this period of super high water. We on Lake M-H almost exceeded the 1986 high water record this year. Yes, the chief cause of high water was the unprecedented high-water supply, but two additional causes have made it worse.
The first of these is the fact that Lake Superior water supply is artificially high because during WW II, water was diverted from the James Bay Basin into Lake Superior at Long Lac and Ogoki to generate extra hydropower for the war effort. But in spite of the fact that the war has been over for 75 years, Ontario Power Generation (OPG) has kept the extra flow and power going ever since, without any regard for water levels. This extra water also enters Lake M-H and raises our levels by an extra 10 cm (4 inches). It is both practical and easily achievable to reduce or eliminate Long Lac and Ogoki. This would reduce hydropower immediately and help alleviate high water levels after a long delay due to the huge size of the lakes. This reduction took place during previous high levels in the 1970’s, 1980’s and 1990’s. Now the IJC has not even asked OPG to reduce the inflow during high water. Why not? We don’t know although many have asked.
The second additional cause of MH high water, is the regulation of the Lake Superior outflow. This is governed by the International Lake Superior Board of Control (ILSBC) under the IJC. It is set by Plan 2012, a regulation plan that calculates the monthly outflow target. In so doing, it has a lake level balancing algorithm that attempts to fairly balance Lake Superior and Lake M-H levels around their long-term averages. Lake Superior is tightly held to a range of 4 feet while our part of the system fluctuates by about 6.5 feet. But, the ILSBC has recently regularly overridden Plan 2012 and over-discharged into M-H. There is a lack of transparency as to how much this is contributing to M-H extra high-water levels, and why these decisions were made. There is the apparent need to review the balancing algorithm and for the ILSBC to not over-discharge as it has in the past.
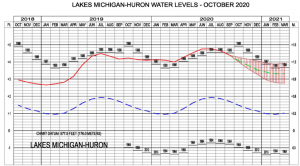
For what it is worth, The USACE October long term forecast is shown below, and our February 2021 level is forecasted to be some 20 cm (8”) lower than this past February. So at least we are expecting slightly lower levels next year.