Bill Bialkowski, June 11, 2020
As I write this water levels update, the US Army Corp reports that Lake Michigan-Huron and Georgian Bay (MH/GB) is 5 inches higher than ever recorded in June. We are 1.37 metres or 54 inches above chart datum (176 meters above sea level) and only 4.5 inches below the all-time high-water record of October 1986. As in the last six years, we are higher than this time last year, by 8 inches, and are forecast to rise 2 more inches before we crest in July. That should put us about 2 inches below the October 1986 all-time record high. Hopefully, the level will then start to recede. But wait, there is more.
You may ask- what is going on! Why are the levels so high, and why are they not coming down like they used to? The recent GBF Water Levels Webinar simply repeated what the government agencies are saying – we have had record breaking precipitation – its climate change, so get used to it.
The current high water was caused by record-breaking water supply in 2014 and 2015, but that is not the whole story. It is complicated as always and involves not only the whole Great Lakes – St Lawrence Basin geography, hydrology and climate science. The map below presents the details of the Great Lakes – St Lawrence Basin, including all of the levels, flows and Net Basin Supplies (NBS). It shows the Long Lac and Ogoki diversions that have fed extra water into Lake Superior since 1940. Our question during this high-water crisis is why not cut these back as has been done previously?

A quick primer. Canada and the US signed the 1909 Boundary Waters Treaty, and formed the International Joint Commission (IJC) to administer it. The IJC sets the rules by which the Great Lakes waters are to be administered. It oversees three boards of control that oversee the monthly discharge of water, from Lake Superior, Niagara Falls and Lake Ontario. There are no controls or discharge oversight for Lakes MH/GB. Further, the IJC can only advise government on what to do. The governments often ignore the IJC and do not follows the recommendations. The technical agencies include Environment Canada and Climate Change (ECCC), and the US Army Corps of Engineers (USACE) who carry out the actions needed by the control boards, and also compile the monthly water levels, channel flows, and the water supply to each lake, the net basin supply, or NBS. ECCC and the National Atmospheric and Oceanic Admiration’s (NOAA) Great Lakes Environmental Research Lab (GLERL) also compiles NBS data, although differently.
In 1998 water levels suddenly dropped to record lows, and stayed there till 2014. Wetlands shriveled up and some people could not get to their cottages. This was when feverish work started to try to figure out what was going on. This was led by Mary Muter, Chair of Georgian Bay Great Lakes Foundation (GBGLF) who organized the retaining of Baird and Associates, Coastal Engineers to study the problem. The 2005 Baird Report revealed that the capacity of the St Clair River, the main outflow from Lakes Michigan-Huron and Georgian Bay, had expanded an additional 10% over and above what the IJC had accounted for, based on the navigational channel dredging that had occurred between 1900 and 1962. This combined expansion of the river had lowered Lake Michigan-Huron, Georgian Bay by 20 inches, 50 cm during low water periods. The troubling part of this story was that the new erosion was completely missed by the government agencies and it took a private initiative to discover it.
The Baird Report put its finger on the likely cause of this significant miss. Both ECCC and USACE record the net basin supply, or NBS, using what is called the ‘residuals method’. Simply put, calculate how much each lake level went up or down each month. The NBS is this volume of water, less inflows plus outflows. This works as long as the flows are accurate. There are problems however on Lake Michigan-Huron, because the St. Clair River flow is calculated based on a river level gage equation. This is accurate after it has been recalibrated to account for the current river depth, but the calibration is laborious and is done infrequently. To complicate matters further, in 2011 the USACE installed an acoustic velocity meter (AVM) in the St. Clair River to help determine the river flow. To calculate flow from velocity also requires accurate river depth measurements. At present this depth calibration appears to be seriously overestimating the true flow. Yet the USACE appear to begiving the AVM flow calculation a very high weight in establishing the ‘official’ monthly St. Clair River flow. The result is that NBS supply is further inflated, while the St. Clair River conveyance capacity is lost to the four winds.
Unlike the USACE, the NOAA Great Lakes Environmental Research Lab (GLERL) compiles NBS data using the ‘components method’ – precipitation, plus runoff less evaporation. This is an extremely difficult calculation to make, as there are few measuring stations in the middle of large lakes.
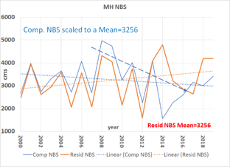 So what about right now? We have been told that the water supply, or NBS has simply been going up and up. The graph on the right compares the annual NBS using both methods for the last 20 years. It shows a different story. Yes, the residual NBS has been slowly rising (red line). However, the components NBS has been falling. Especially, between 2008 and 2014, when the decline was very rapid. When the two NBS methods differ, errors in St. Clair flow have been made.
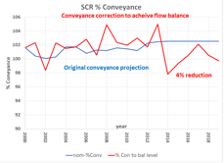 If the NBS has been declining, and not rising, why are the levels going up and not coming down? With a little hydraulic modeling and water balancing, it is possible to extract a St. Clair River flow ‘conveyance capacity’ graph as seen on the right. The blue line is the conveyance capacity we had been calculating through to 2012 based on earlier work. The red line is the result of re-balancing the St. Clair River flow with actual water levels, and the components NBS. It shows a sudden 4% reduction in 2104. Somehow, the St. Clair seems to have suddenly ‘clogged’ up, hence reducing the outflow and causing the level to rise. While this has not been ‘officially’ proven, it is collaborated by the fact that since 2014, the seasonal decline pattern for Lake Michigan-Huron has changed radically. Normally, levels start to decline in July or August, and decline by about a foot by January or February. Since 2014, this decline has become much smaller and less pronounced. Clearly the water is being held back, and as a result each year we start the cycle a little higher, as the normal amount of water has not had time to drain before spring starts. As a result, we start each year a little higher. At the same time, it has been noticed that the amount of sand being carried by the water entering the St. Clair has dramatically increased, as groynes built to hold sand back on Lake Huron beaches have been overwhelmed by the high water. This suggests that the likely cause of the ‘clogging’ is sand deposited in the river. But then, a recent bathymetric (depth) survey has not been done yet. Till then we will not know.
We have advised both the US Army Corps and Environment Canada of all of these concerns and are in discussion with them to help clarify the cause of this super high-water.
In April and May, Mary Muter, Chair GBGLF and Roger Gauthier, Chair of Restore Our Water Levels International ( ROWI), put on a Water Level Webinars (https://www.georgianbaygreatlakesfoundation.com/wp-content/uploads/Webinar-ROWI-20200507FL.pdf) which described the many layers of this saga in detail. An appeal was made for the participants to contact their elected officials to demand practical action that can reduce the current crisis levels and improve how water levels are managed going forward. What could be done? The Long Lac and Ogoki diversion into Lake Superior could be reduced and the discharges from Lake Superior could also be reduced. Why do we have to continue to be the forgotten cousin on the Great Lakes?
In conclusion, our water levels have changed once again, as now it appears that the St. Clair River has been partially clogged with sand, causing Lake Michigan-Huron to back-up. The cycle of increasing water levels is likely to continue into 2021 and beyond.
*Bill Bialkowski, is a Board member – Georgian Bay Great Lakes Foundation (GBGLF) and Restore Our Water International (ROWI)